
GRAND RAPIDS, Mich. (WOOD) November 25, 2024 – Monday
The official end of the Atlantic Hurricane Season is November 30th. I don’t see any tropical storm activity in the next 10 days to 2 weeks and probably beyond that. So there’s a good chance that tropical activity for the Northern Hemisphere has ended for the year. 2024 featured the earliest Category-5 hurricane in the Atlantic basin and the deadliest hurricane to strike the U.S. since Hurricane Katrina in 2005 (pic is damage from Hurricane Helene in Western North Carolina).
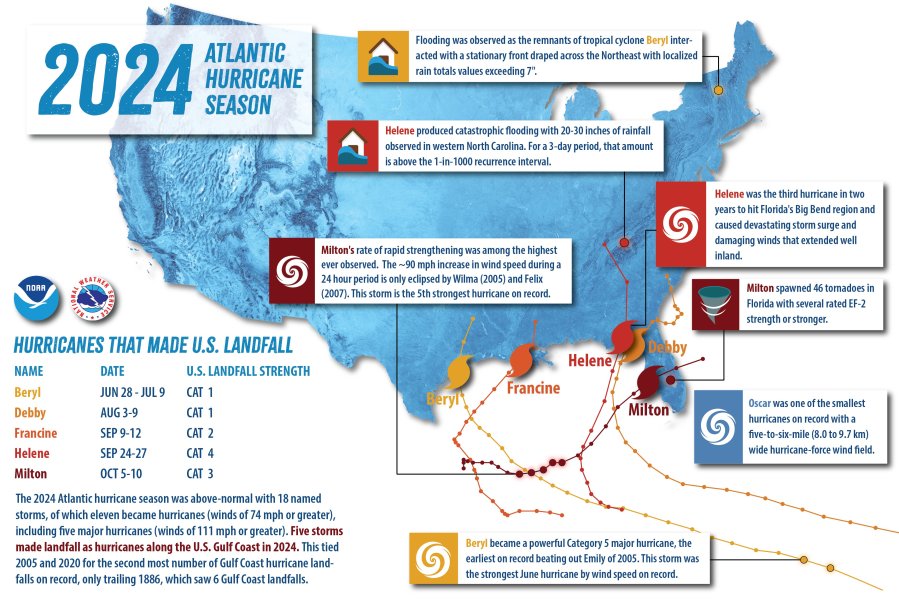
Of the 18 names storms so far this season, 11 developed into hurricanes. Of those 11 hurricanes, five reached major hurricane strength. (Category 3 or above). The storms resulted in approximately 400 fatalities. It was the second costliest hurricane season in the Atlantic sector with total damage estimates now over 191 billion dollars.

Here’s the latest Tropical Weather Outlook from the National Hurricane Center (the map should update automatically.
Sara has produced some heavy rainfall and local flooding

Here’s a satellite pic. of the Atlantic.

All is quiet in the Eastern Pacific (this map will also update automatically).
Here’s the Eastern Pacific Tropical Discussion in English and in Spanish.
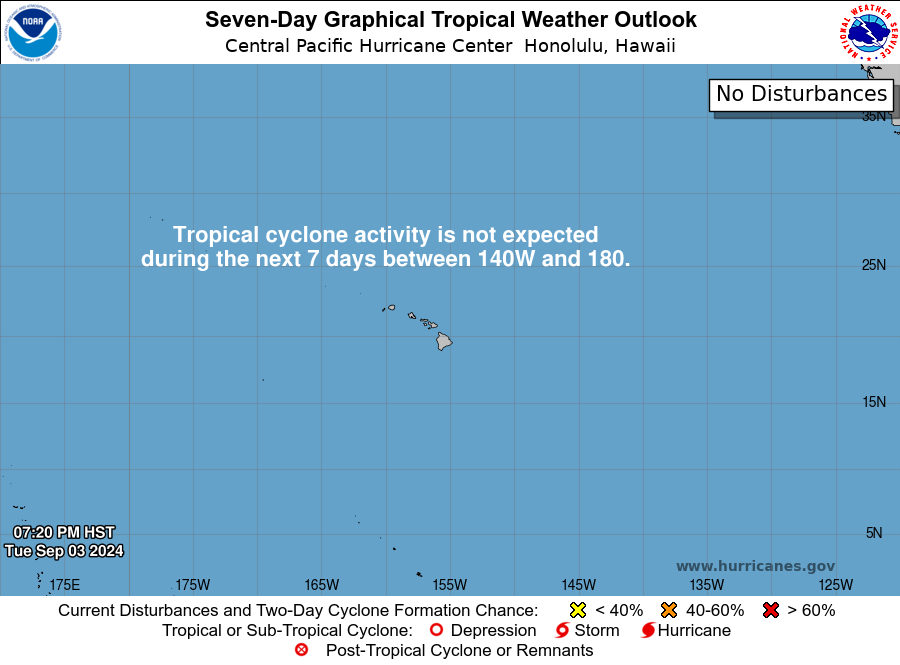
The map above is the Central Pacific Ocean (with Hawaii in the middle of the map). There will be no tropical storm activity in the next week in the Central Pacific and none is expected through the end of the year. (map updates automatically).
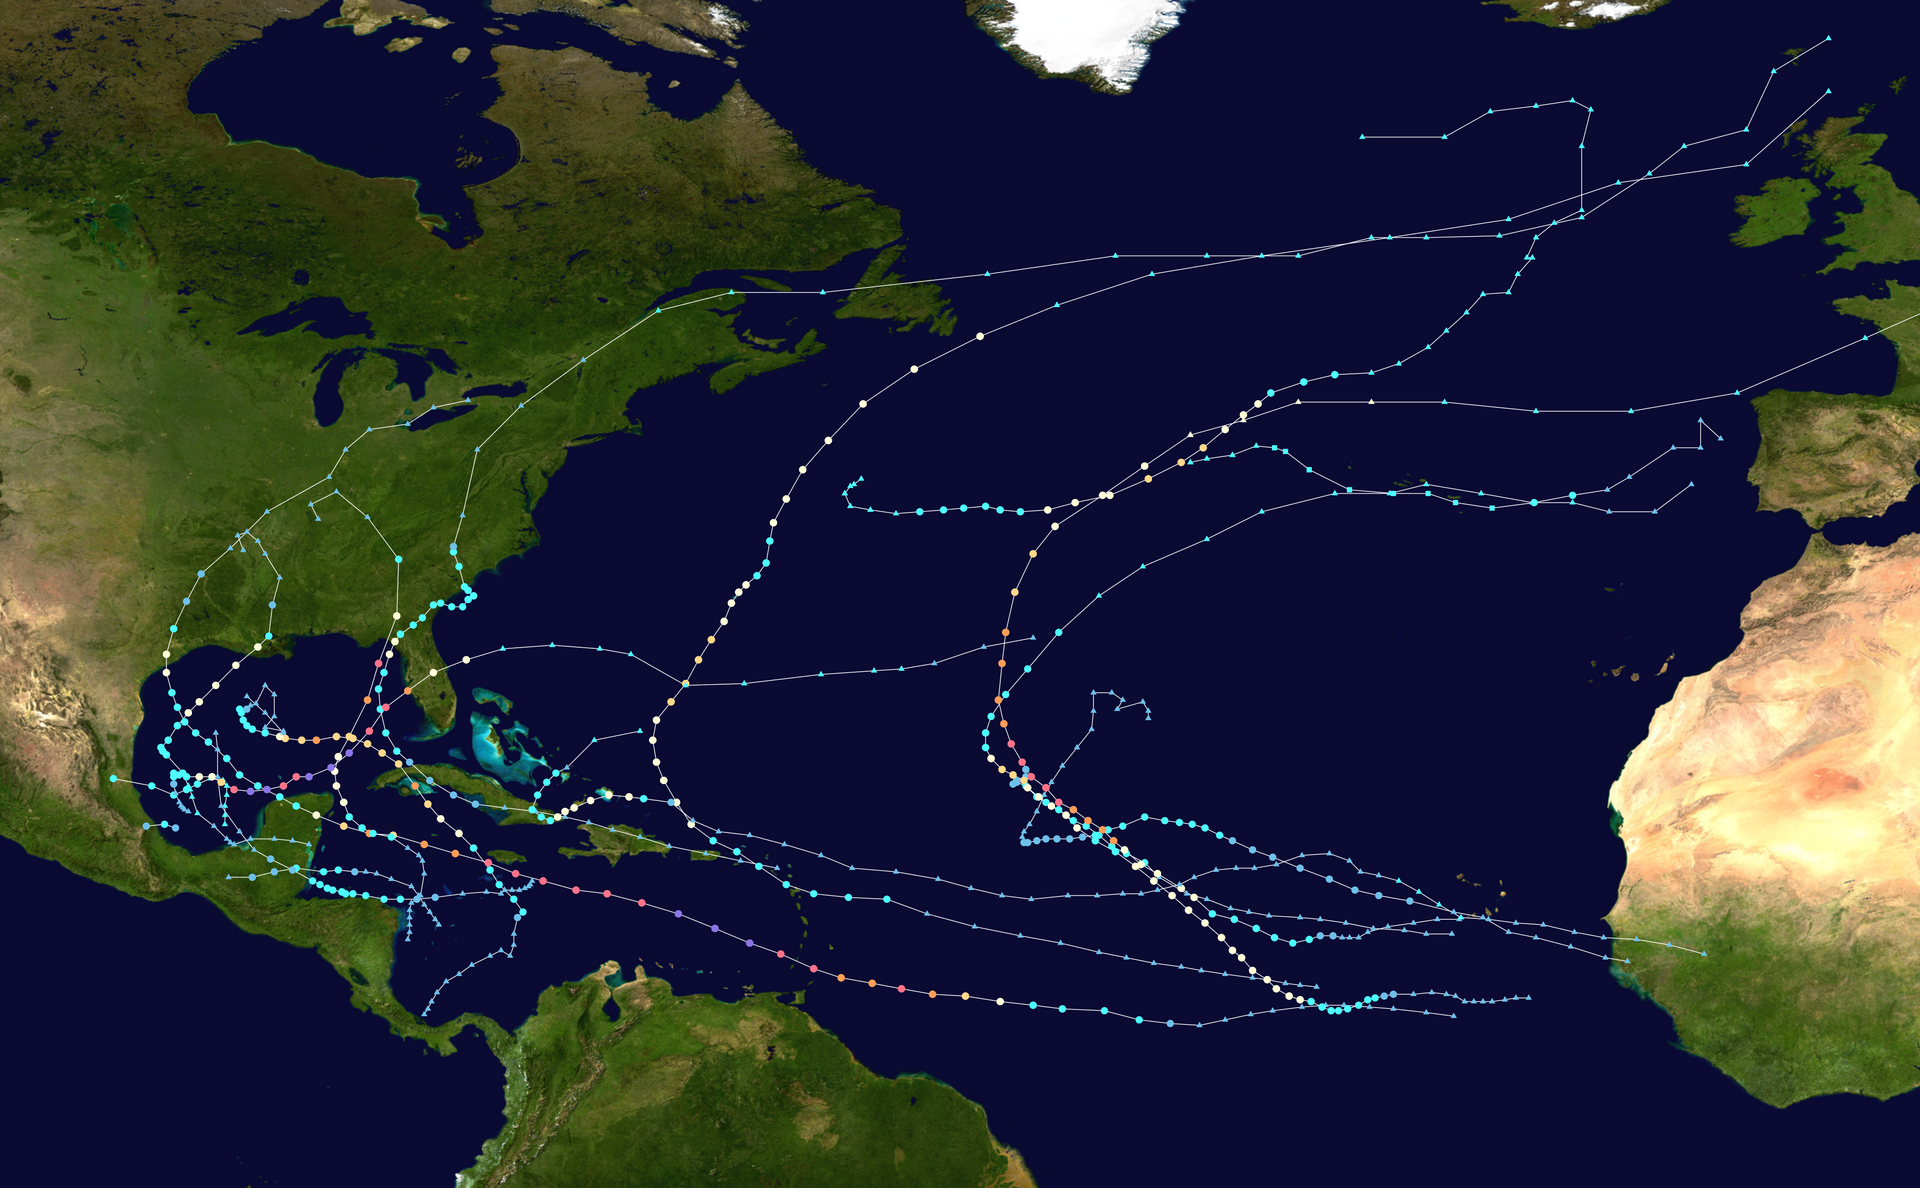
Here’s the tracks of the tropical storms and hurricanes in the Atlantic Sector in 2024. This map shows the tracks of all tropical cyclones in the 2024 Atlantic hurricane season. The points show the location of each storm at 6-hour intervals. The color represents the storm’s maximum sustained wind speeds as classified in the Saffir-Simpson Hurricane Scale. (pic. is public domain – MarioProtIV – Created using Wikipedia:WikiProject Tropical cyclones/Tracks. The background image is from NASA. The tracking data is from the National Hurricane Center).
Here’s Southern U.S. combined satellite and radar. (map updates automatically)
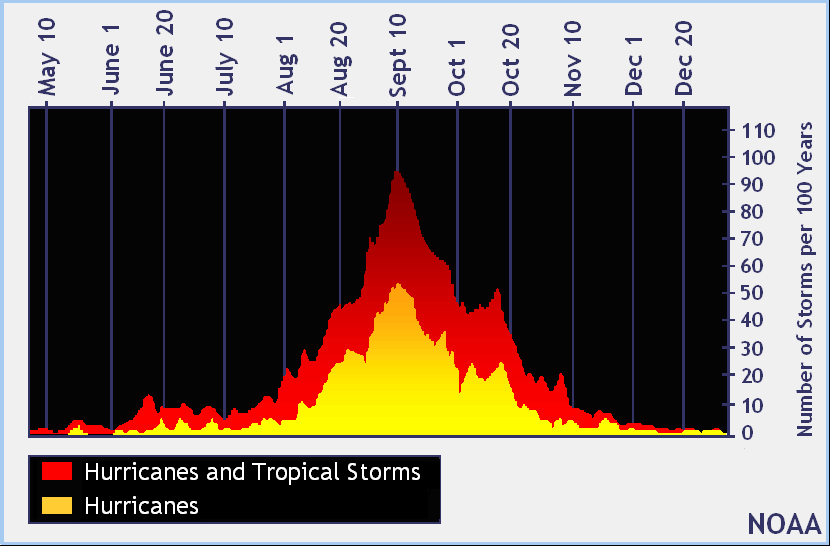
The graphic above shows the average number of hurricanes and tropical storms from May through December. The peak of the Atlantic hurricane season was Sept. 10. While a tropical storm or hurricane can occur at any time during the winter, the odds of one significantly affecting the U.S. is very small.
Here’s a link to a nice summary of tropical storm activity in the Atlantic/Caribbean/Gulf of Mexico in 2024.
Here’s a summary of tropical storm and hurricane activity in the eastern Pacific in 2024.
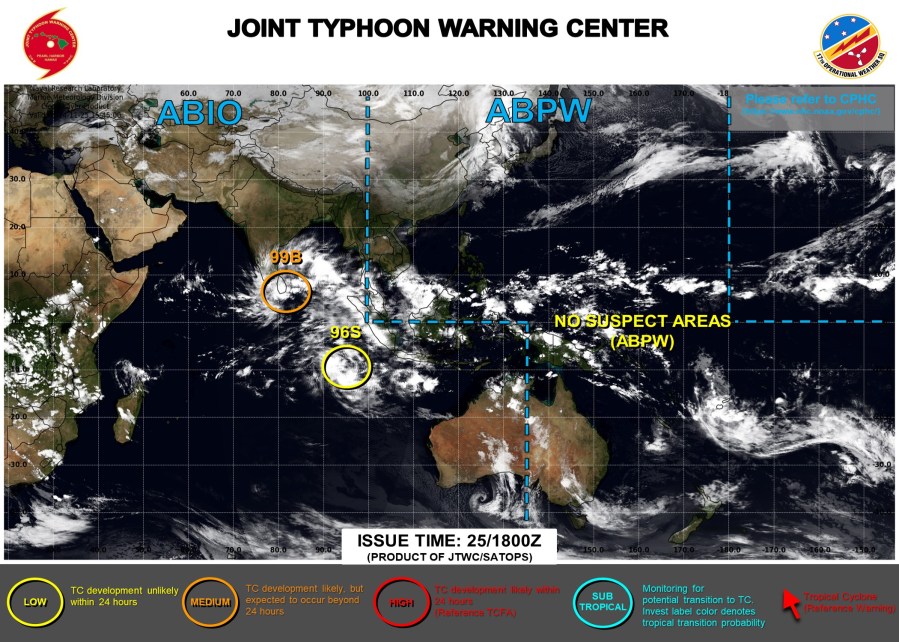
Here’s a satellite view of the western Pacific and Indian Oceans. There are two areas of thunderstorms that we are watching, called 99B and 96S. One is near the southern tip of India/Sri, Lanka and the other is closer to the Equator. The storms in southern India have only a small chance of development.
“Yinxing came into Vietnam and dissipated. The storm produced significant damage on the north coast of the island of Luzon in the Philippines.
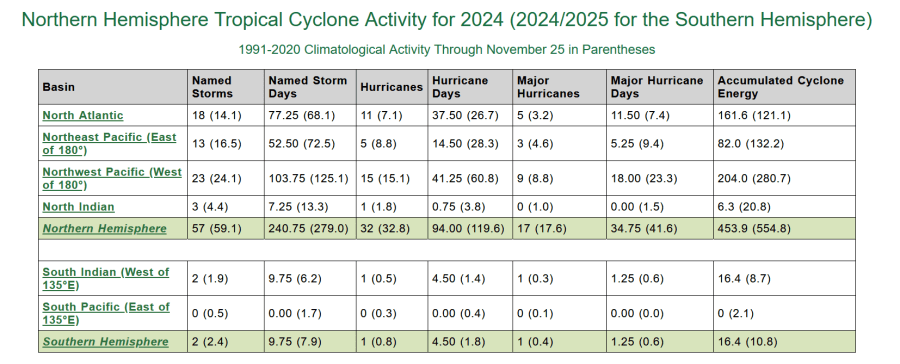
Here’s the latest ACE Index, a measure of the number and strength of tropical storms and hurricanes. The North Atlantic Sector has a cumulative season ACE of 161.6. That compares to an average ACE-to-date of 121.1. So, that’s 133.4% of average ACE-to-date. It has definitely been an active year for hurricanes in the Atlantic Sector and the Southeast U.S.
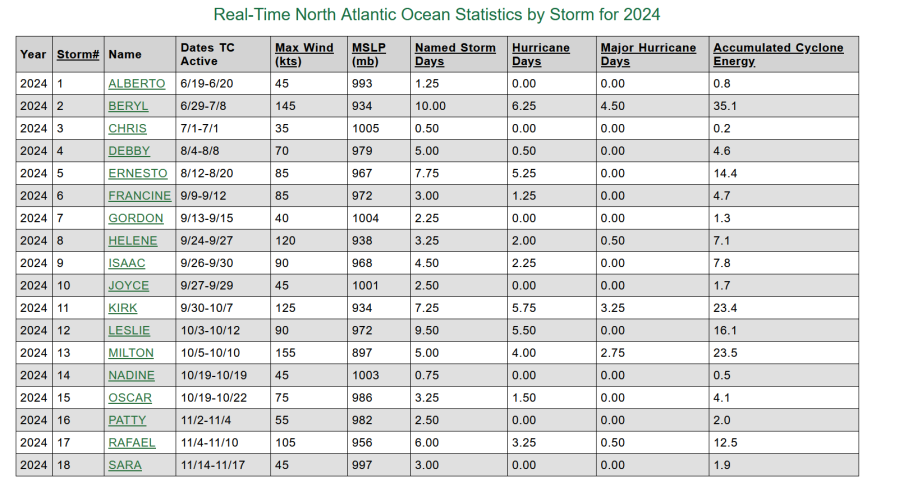
Above there is a table with a summary of each of the hurricanes of 2024. Of the 161.6 ACE in the Atlantic Sector, 35.1 of that came from long-lived hurricane Beryl. Hurricane Helene accumulated only 7.1 ACE Points because it was only a hurricane for two days. However, Helene was the deadliest and costliest hurricane of the season in the Atlantic sector.
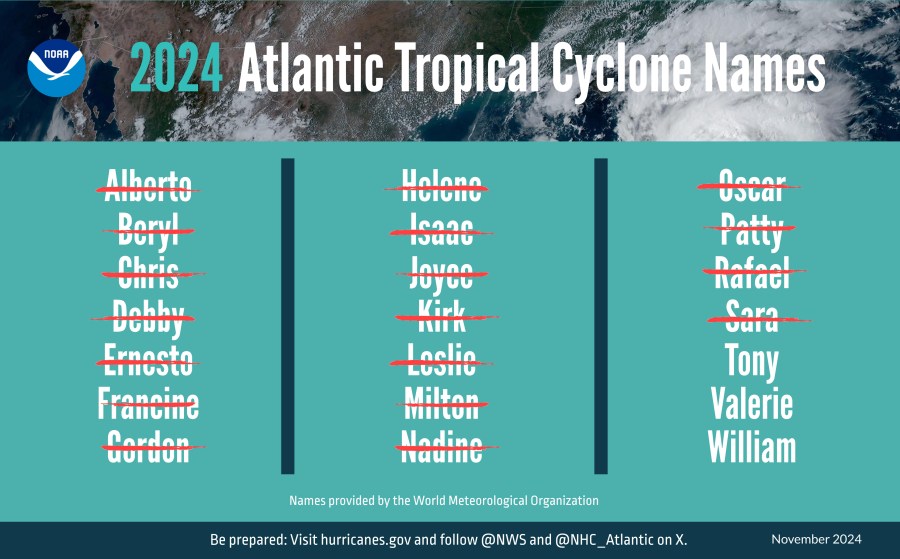
Two named storms, Alberto and Chris were much smaller and short-lived and then we had Debby, which was a Category 1 storm and Ernesto, that gave 84 mph winds to the island of Bermuda. Francine added a little to the Atlantic ACE as came ashore and hit Mississippi and Louisiana. Tropical Storm “Gordon” reached tropical storm status for 2 days in the mid-Atlantic. It did not affect land areas. We then had hurricane “Kirk” and hurricane “Leslie“, Those storms stayed over the Atlantic. They were followed by “Milton” (that did considerable damage in central Florida), “Nadine” and “Oscar” (which produced significant flooding in eastern Cuba). “Patty” was a brief and inconsequential storm that remained far from land. “Rafael” ramped up to Category 3 status on Nov. 6 but then faded away just as quickly as it moved into the Gulf of Mexico. Sara moved into Mexico and dissipated.
All other global sectors have well below ACE-to-date figures. It was the quietest start ever for the eastern Pacific. The ACE in the eastern Pacific sector is currently at just 82.0. Average-to-date ACE for this sector is 132.2 That’s just 62.0% of average ACE-to-date.
The Western Pacific Ocean Sector has an ACE-to-date of 204.0, compared to an average ACE-to-date of 280.7. This is just 72.7% of average ACE-to-date.
The North Indian Ocean has an ACE-to-date of 6.3, again well below the average ACE-to-date of 20.0. That’s about 1/3rd of the average ACE.
If you take the entire globe for the entire year, you get a global ACE-to-date of 470.3. That compares to an average ACE-to-date of 565.6 and that’s 83.2% of average ACE-to-date.
So, while we’ve had an active year for hurricanes in the U.S. and the Atlantic Sector, if you look at the entire globe, this has been a relatively quiet year for tropical storm activity.
Thanks for reading Bill’s Blog.


